Cleantech & Investment
Solar Undercuts Wind and Biogas for Water Pumping Across Six Nigerian Sites
A MATLAB study of six Nigerian sites puts solar PV ahead on pumping electricity cost, with wind at US$1.84–8.58/kWh and biomass at US$0.42–1.11/kWh. Wind shear varies sharply nationwide.
Waypoints
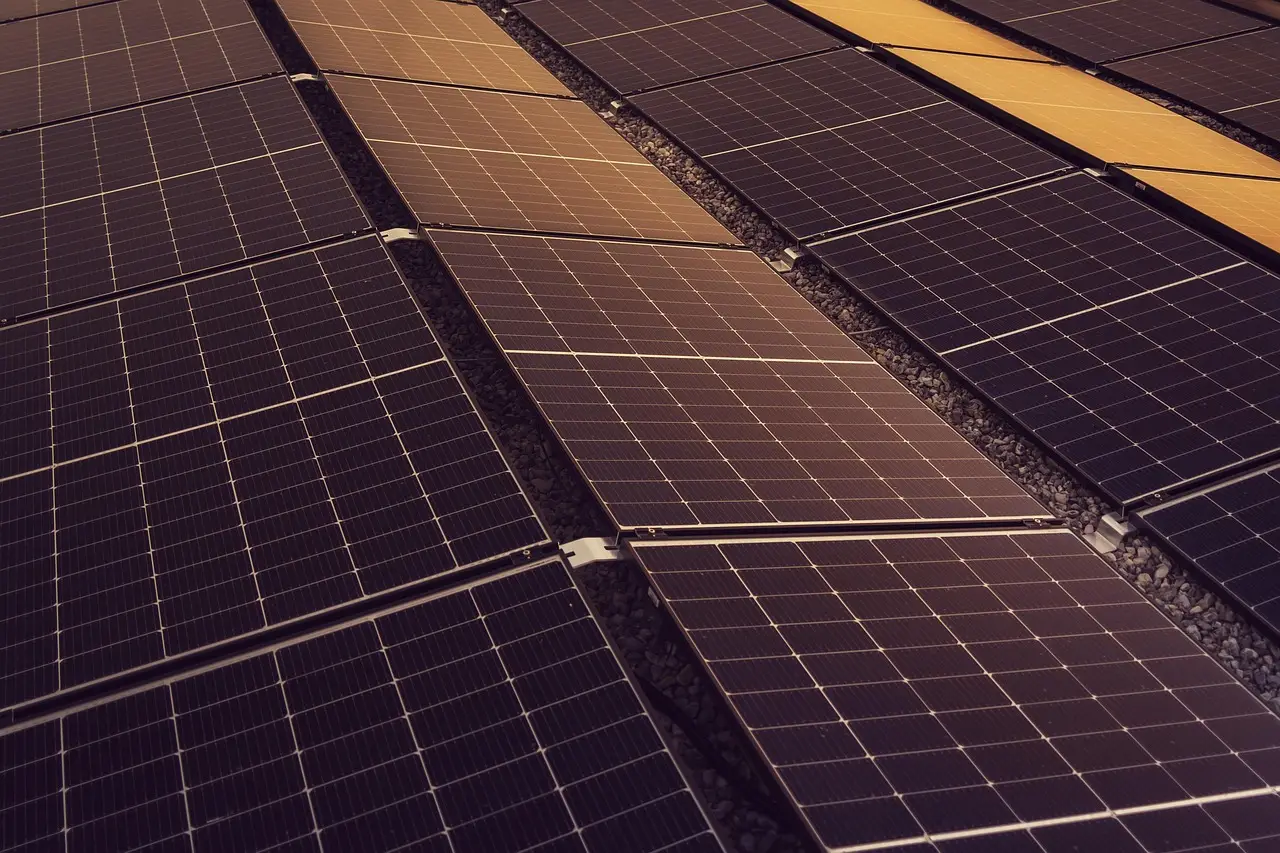
Solar PV showed the lowest modeled pumping electricity cost at all six Nigerian study sites, published 20 October 2026 in Energy & Environment Nexus.
Wind electricity cost US$1.84–8.58 per kWh; biomass cost US$0.42–1.11 per kWh in the comparison.
The Panasonic PV module posted the highest capacity factor at every site, 15.08% in Benin City to 19.09% in Dutse.
The EWT DW 54 turbine reached capacity factors of 3.72% (Benin City) to 43.85% (Bauchi).
Wind shear exponents ranged from 0.10 in Calabar to 0.48 in Asaba across Nigeria's 36 state capitals and the FCT.
Solar photovoltaics delivered the lowest modeled electricity cost for water pumping at all six Nigerian university sites studied, beating wind by a margin of roughly two dollars per kilowatt-hour and biogas by a narrower one. The comparison appears in a study published on 20 October 2026 in Energy & Environment Nexus (DOI: 10.48130/een-0026-0019), led by Richard Oladayo Olarewaju of Abiola Ajimobi Technical University.
The stakes are practical. Nigerian communities and institutions face limited grid access and expensive pumping operations, and reliable water supply depends on reliable electricity. Earlier assessments of solar, wind and waste-derived biogas covered few locations, compared limited equipment options, or emphasized resource availability while sidelining cost.
What did the researchers measure?
The team drew on 11 years of NASA wind-speed and solar-irradiation data, covering 2014–2024, for university sites in Ibadan, Abakaliki, Benin City, Abuja, Bauchi and Dutse. MATLAB simulations compared nine commercial wind turbines and ten photovoltaic modules.
The method stacked several layers:
- Pumping power requirements extrapolated from a reference pumping system using site populations
- Biomass generation estimated from municipal waste availability and anaerobic digestion models
- Capacity factors, describing output relative to rated capacity, plus unit electricity costs incorporating investment, operation and maintenance assumptions
- Wind measurements at 10 and 50 metres, used to calculate wind shear across Nigeria's 36 state capitals and the Federal Capital Territory
The analysis also examined equipment selection, financing conditions, annual changes and seasonal variability.
Which equipment led the rankings?
Among photovoltaic modules, the Panasonic model achieved the highest capacity factor at every site, ranging from 15.08% in Benin City to 19.09% in Dutse. Its relatively low temperature-related power losses explain that performance.
The EWT DW 54 turbine led the wind comparison, with capacity factors from 3.72% in Benin City to 43.85% in Bauchi, reflecting its ability to reach rated output at comparatively low wind speeds.
The verdict on cost, however, was unambiguous. Biomass electricity cost US$0.42–1.11 per kilowatt-hour; wind cost US$1.84–8.58. Solar came in cheapest across the board.
Selecting turbines for maximum capacity factor substantially reduced wind electricity costs at several sites. That result carries a lesson: matching equipment only to pumping demand can overlook more productive configurations.
The wind shear findings point the same direction. Exponents ranged from 0.10 in Calabar to 0.48 in Asaba, indicating that a single assumed value could misrepresent local wind conditions. The biomass sensitivity analysis, meanwhile, showed electricity costs rising with discount rates, which places financing assumptions alongside resource quality in any credible project appraisal.
What does this change for planning?
The study offers a comparative planning framework rather than a universal prescription. Its results support prioritizing solar assessments at the six investigated sites while acknowledging that turbine characteristics, local wind profiles, waste availability and financing can each alter project economics.
The next milestone is deployment-side: targeted feasibility studies at specific sites, using the study's combined resource, equipment and cost methodology, would test whether the modeled solar advantage survives contact with procurement, tariffs and maintenance contracts.
via azocleantech.com (Source)
More from Olivia Hart
Show full bio
Staff writer covering regulation, policy and their impact on Circular economy and the environmental industry at Circular Wire.
475 articles